How to Calculate an Error Bar?
The variability of data can be graphically represented by Error bars. These are frequently used on graphs to show the[…]
Read moreBest Rated Techs, Products and Reviews
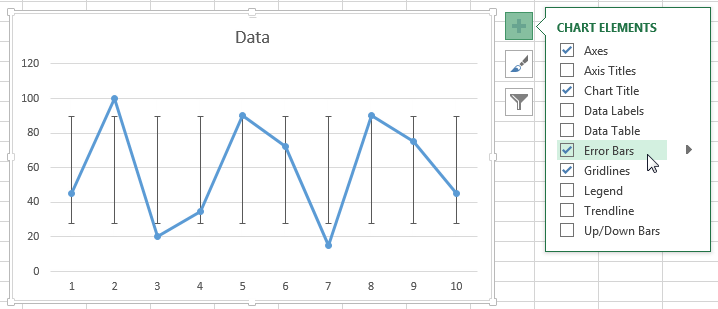
The variability of data can be graphically represented by Error bars. These are frequently used on graphs to show the[…]
Read more